
I analyze Liverpool’s 2022-23 season data and draw insights.
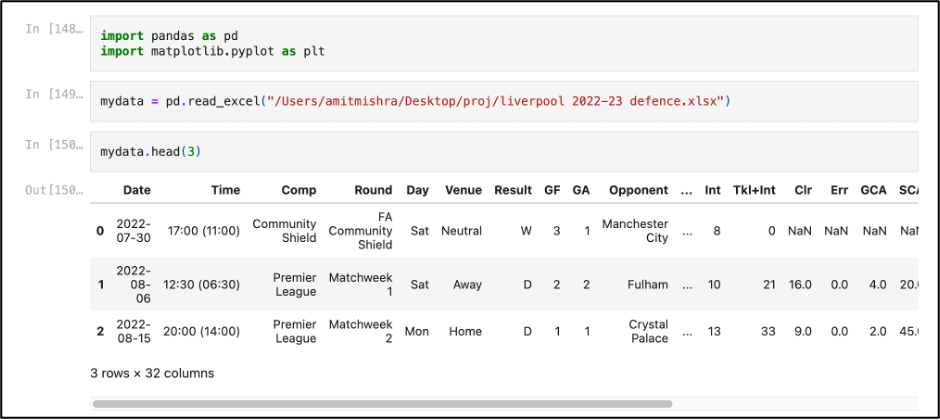
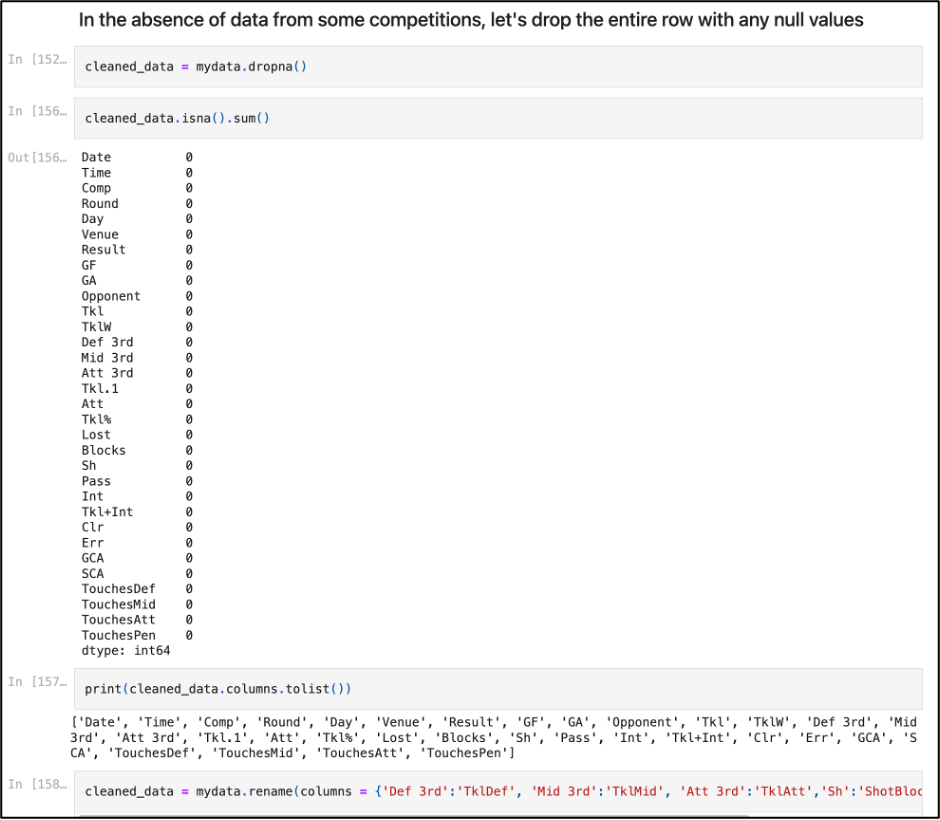
Cleaning the data: I drop the rows with null values and missing data from some competitions


Inferences
Tackles in the defensive third:
The coefficient for TklDef (Tackles in the defensive third) is -0.1108. Holding other variables constant, a one-unit increase in TklDef is associated with a decrease of 0.1108 units in goals conceded.
Generally, this would indicate a good number of tackles in the defensive third is valuable the team. Liverpool in particular are a transition based team, so their ability to get the ball moving forward after making a tackle in the defensive third might be hinted by this statistic.
Clearances:
The coefficient for Clr (clearances) is 0.0107. Holding other variables constant, a one-unit increase in Clr is associated with an increase of 0.0107 units in goals conceded.
For a team that doesn’t like to clear the ball away and work on making their way to the front when they do win the ball, it makes sense that the higher the number of clearances, the more likely that they will concede.
Pinning Liverpool in their own half:
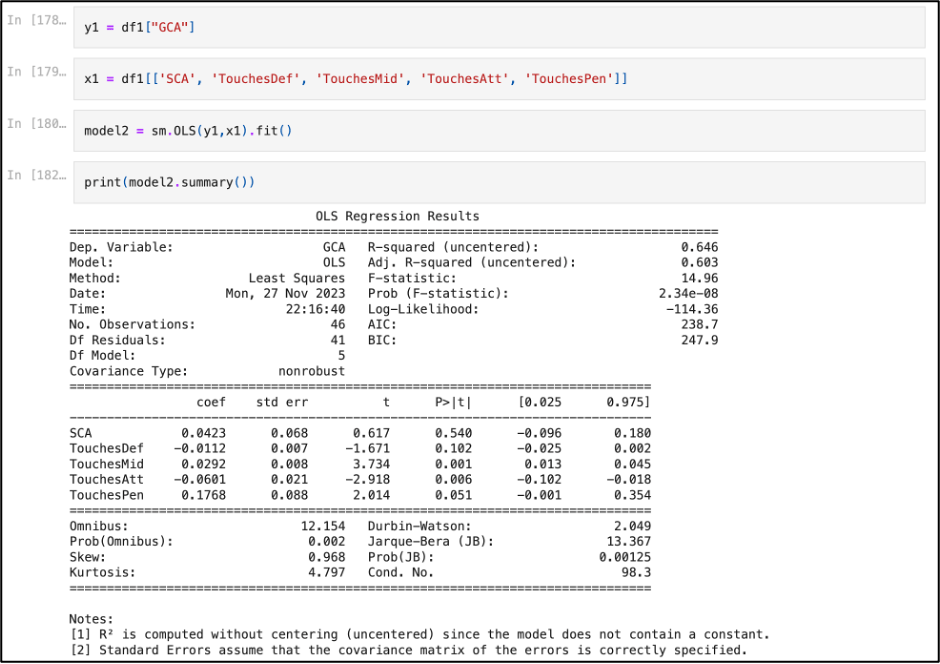
-> The coefficient for TouchesDef is -0.0112. A one-unit increase in TouchesDef is associated with a decrease of 0.0112 units in GCA (Goal Creating Actions)..
A fairly straight forward result as the more touches you make Liverpool take in their own half, the less likely they are to score, which is confirmed by the negative sign in TouchesDef.
Avoiding transitions against Liverpool is key:
-> The coefficient for TouchesAtt is -0.0601. A one-unit increase in TouchesAtt is associated with a decrease of 0.0601 units in GCA.
This suggests the more touches Liverpool take in the attacking third, the less likely they are to create a goal creating action. This possibly points out their reliance on being a transition heavy team, and as a opposition team, perhaps the best way to not concede is to avoid as many transitions as possible and get men behind the ball.
Defending in the box:
-> The coefficient for TouchesPen is 0.1768. A one-unit increase in TouchesPen is associated with an increase of 0.1768 units in GCA.
Inside the box, there’s a completely different story. He more touches Liverpool take in the box, the likelier it is to score. However, there Is likely to be a cutoff point that can be found using polynomial regression.

Leave a comment