
Example of using tracking data generated from Statsports
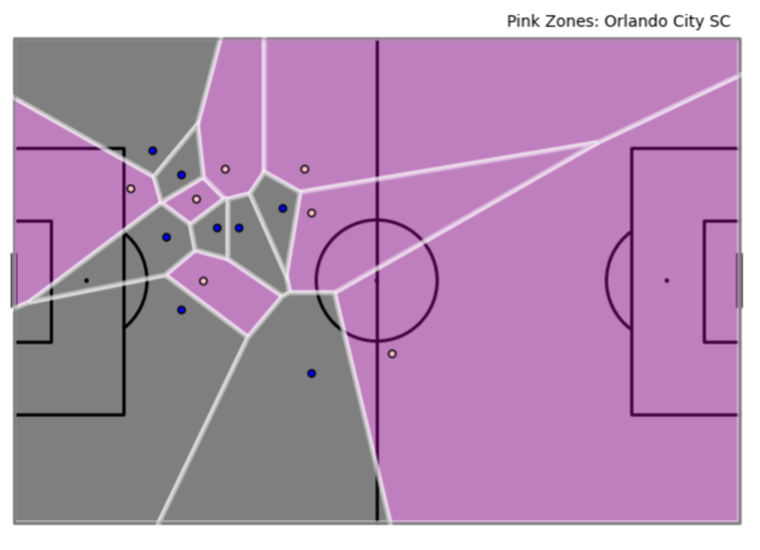
I have generated a Voronoi diagram to indicate spatial control at a particular moment in the game.
Example of using regression to analyze playing style
I have used regression here to analyze a team playing style using available data.
Project: Using player KPIs to predict readiness score (Oura ring)

I have used average resting heart rate, sleep score, and activity score to predict readiness score for athletes.
Dashboards – Tableau
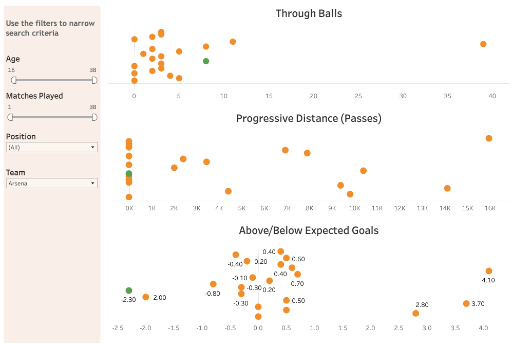
- Player scouting dashboard – Premier League
- Shot map – Soccer
- Causal effect predictor of readiness scores
- Player health dashboard

Leave a comment